


This document contains the data we gathered on the chassis dyno while proving out our Stealth series of turbos for the 2003-2007 5.9L Cummins. This is real, experimental data and therefore may not be perfect. It represents many hours and dollars of hard work by the team at Calibrated Power and is used by our staff to assist customers in the selection of the best turbocharger for their application. This data was amassed by instrumenting the truck with a variety of gauges and probes from Banks Engineering and collating data after each steady-state test. Below you'll find Nick Priegnitz's personal thoughts on the data. These are broken down into two parts, the first is an intro to what the data represents and how it was collected followed by a trends in data as seen through my eyes along with some takeaways.
A quick note on power. All dyno numbers are reported in 'Mustang RWHP'. Do any googling and you'll see that Mustang Dynos are very stingy. If you're comparing to 'internet dynojet numbers' add back 12.5% to any dyno number reported here. Example: if the Stealth 64 (Mach 1) reports 623rwhp on our dyno you can expect 623*1.125=700rwhp on a dynojet.
Table of Contents:
2- Steady State Towing test results with PID Info
4- Max Power Clean (AFR/Lambda limited)
5 -Max Power (Competition use)
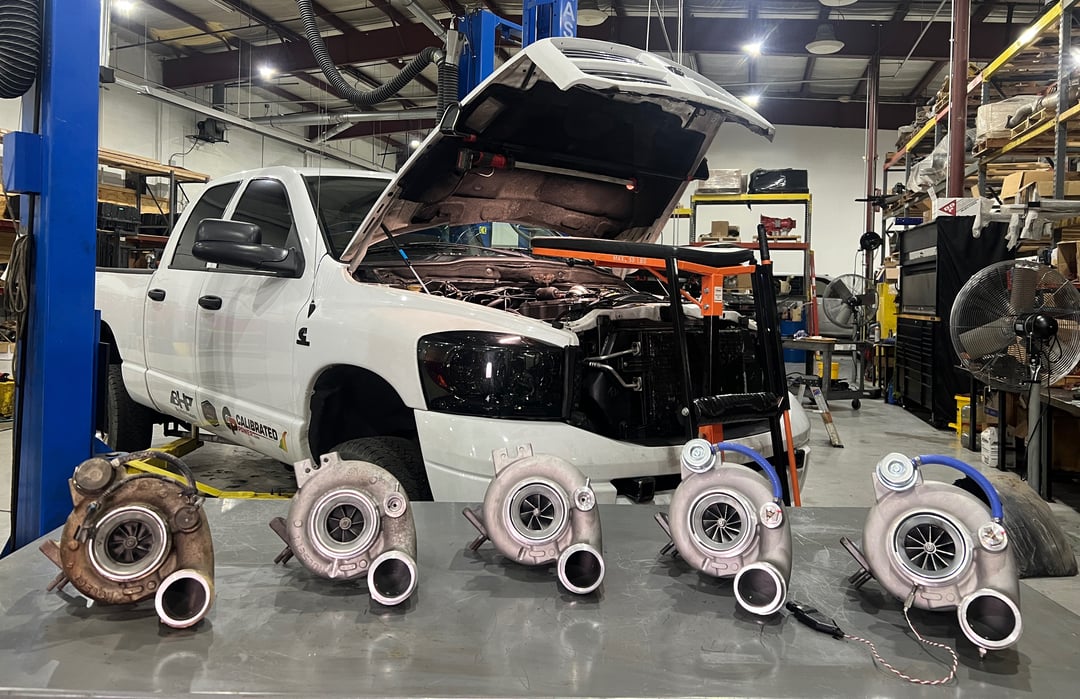
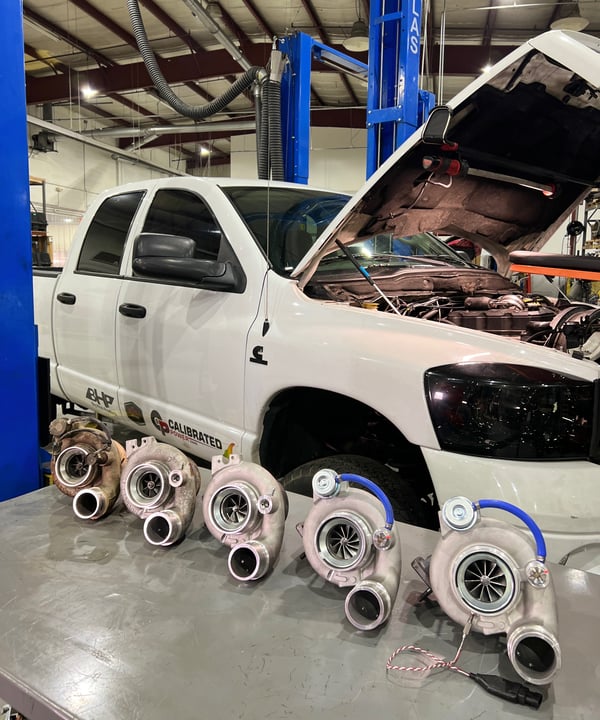
1. The turbos (from left to right)
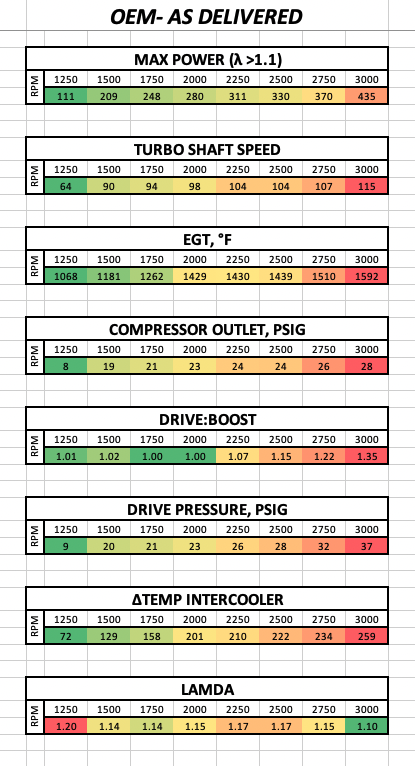
- OEM Stock HE351cw- Stock stock stock. This turbo is a great example of what can be expected from trucks running stock boost limits, either without boost tuning or wastegate mods.
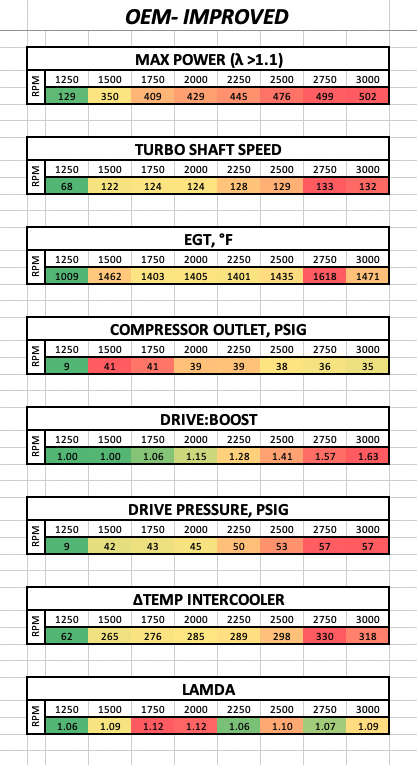
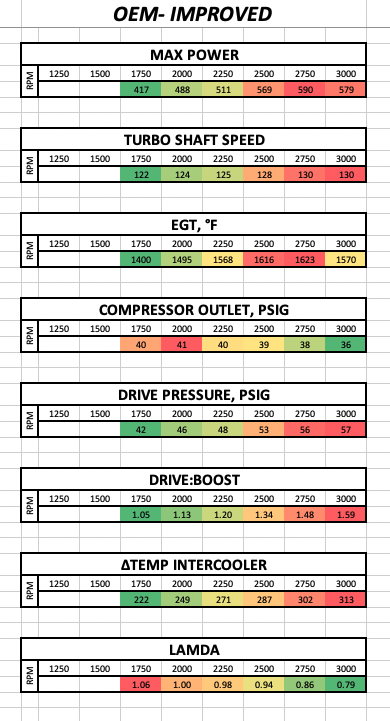
- OEM Improved HE351cw - This turbo is a stock core with a modified wastegate canister and rod adjustment to spec. This upgraded wastegate uses a stronger spring to keep the wastegate circuit at higher drive pressures and also allows peak boost to reach about 37psi.
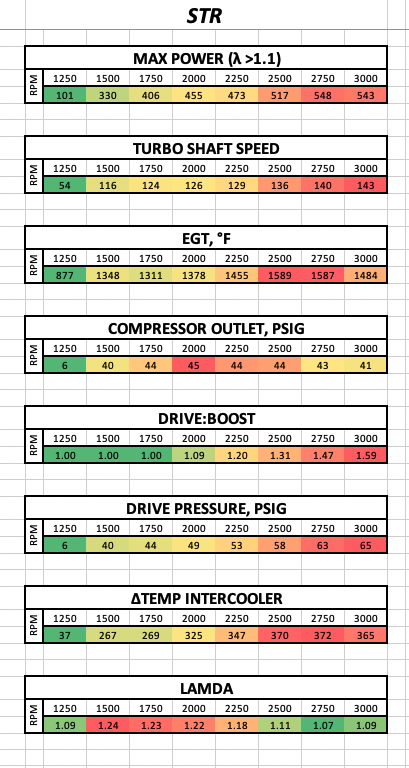
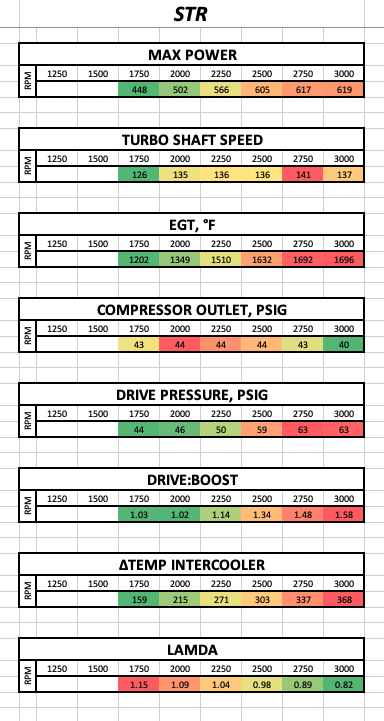
- Calibrated Power STR - This turbo uses an upgraded rotating assembly 60mm x '67 Beastwheel' as well as our upgraded wastegate canister matched to allow about 41psi boost pressure.
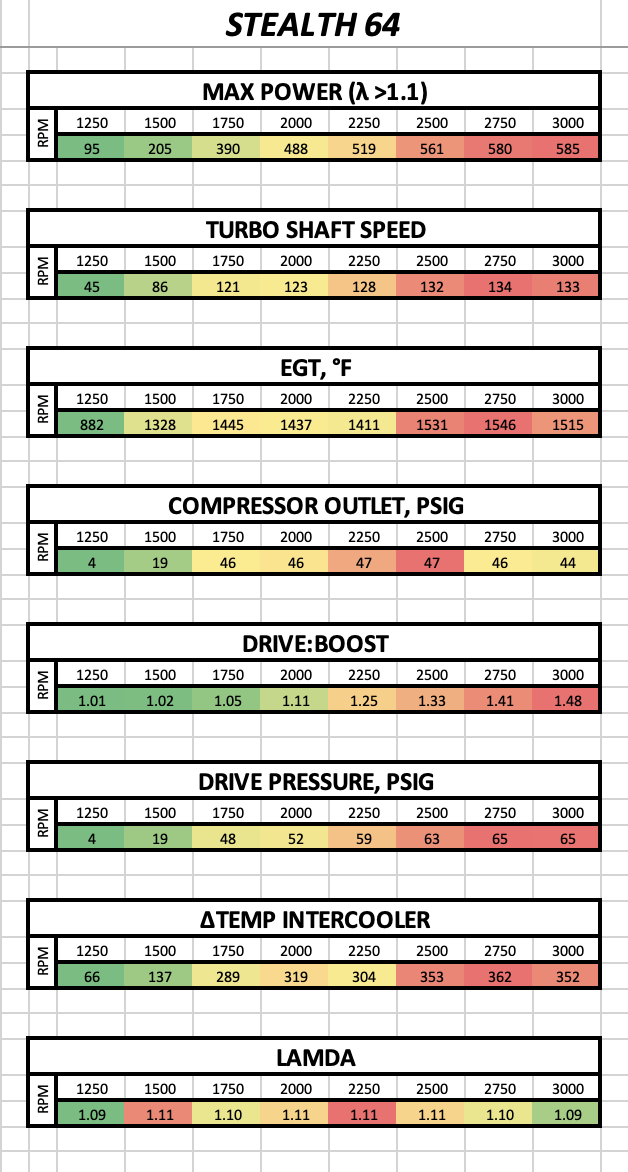
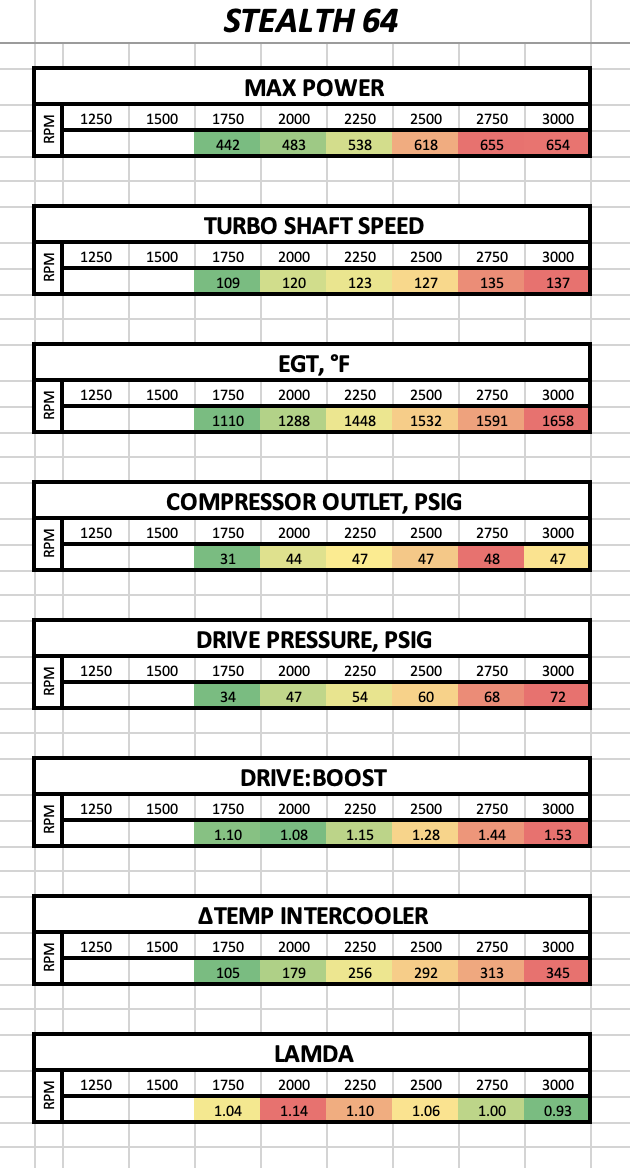
- Calibrated Power Stealth 64 - This turbo uses an upgraded rotating assembly 64mm x '67 Beastwheel' as well as our upgraded wastegate canister matched to allow about 46psi boost pressure.
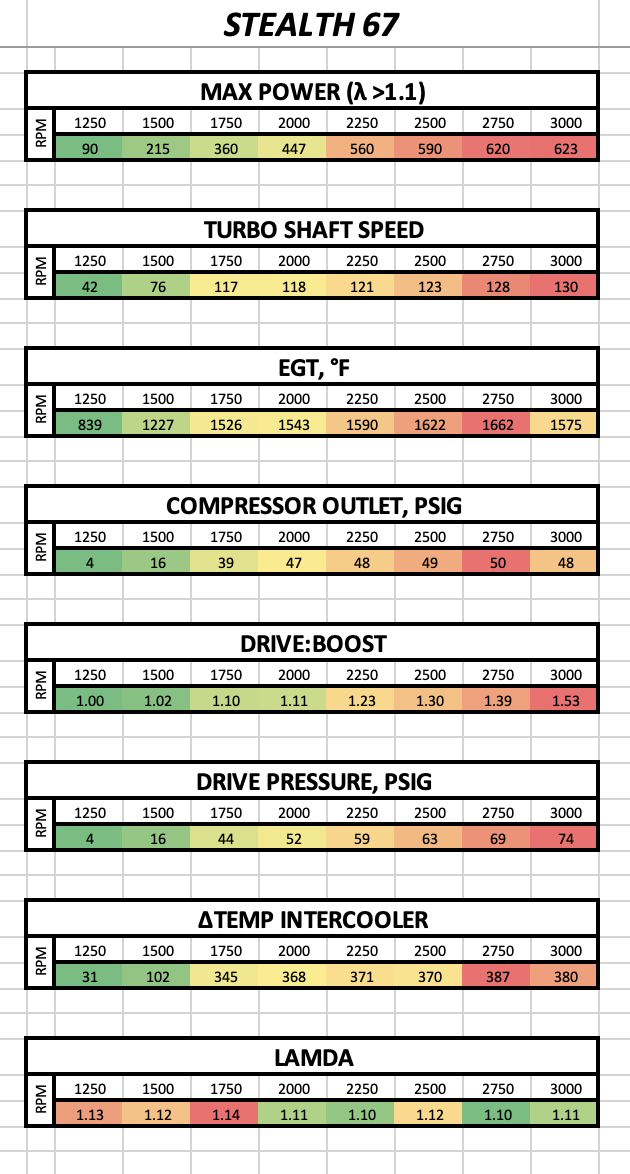
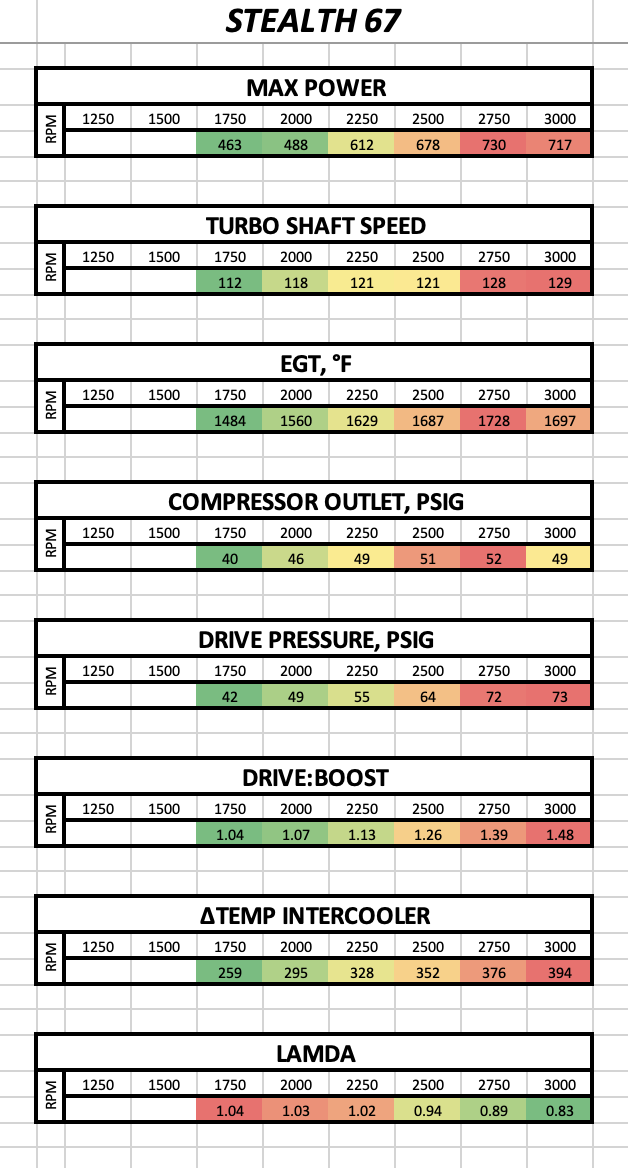
- Calibrated Power Stealth 67 - This turbo uses an upgraded rotating assembly 67mm x '67 Beastwheel' as well as our upgraded wastegate canister matched to allow about 50psi boost pressure.
2. Steady State Towing test results with PID Info
2a. Intro to Lambda:
I'll lead you off with a chart of lambda, these charts directly show how clean the truck is able to run at any given horsepower and RPM. The darker the green (lower numbers), the more likely a truck is to smoke at a given RPM/Load. Lambda refers to the air: fuel ratio during combustion which is measured by a wideband O2 sensor in the downpipe. Lambda of 1.0 equals combustion of 14.6 AFR, 1.1 =16.06 AFR, 1.2 =17.52 AFR etc. If fuel is mixed perfectly with air, 14.6:1 combustion results in clean diesel combustion. Unfortunately perfect mixing is not a reality on this engine (by a long shot) so in order to run clean we need a Lambda value closer 1.15 ( 16.79AFR). The reason it's positioned at the front of the presentation is because of the ability the engine has to maintain Lambda 1.15 or higher is a great indicator of the engine's overall happiness in operation. Small differences in lambda (.05) have significant impact on smoke output, EGT, and of course, reliability. The turbo has a largest impact on AFR at any HP/RPM because it directly dictates the amount of fresh airflow coming into the engine.
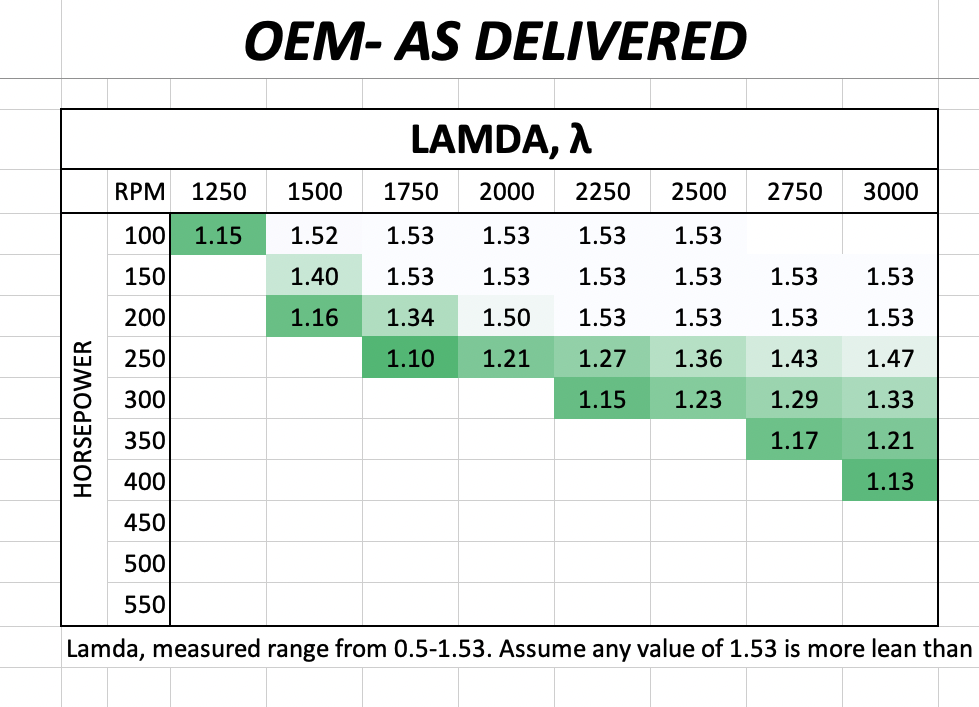
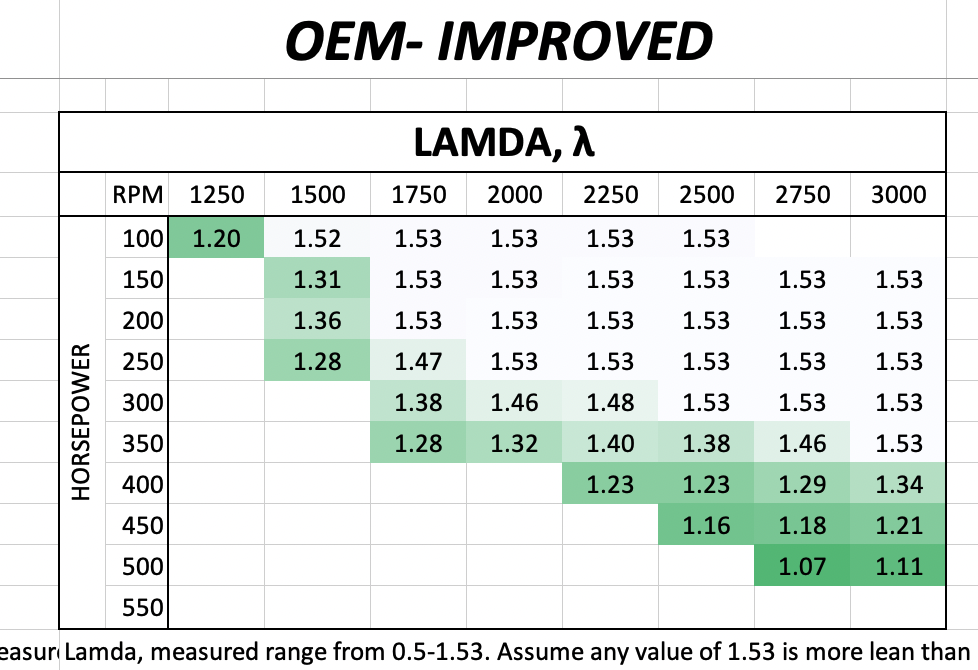
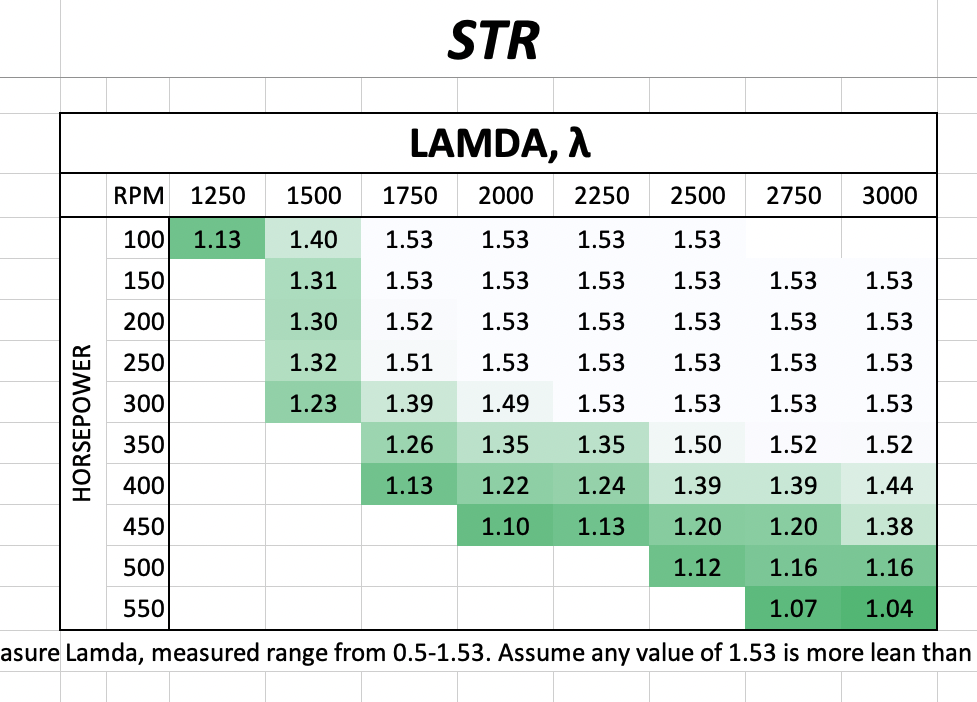
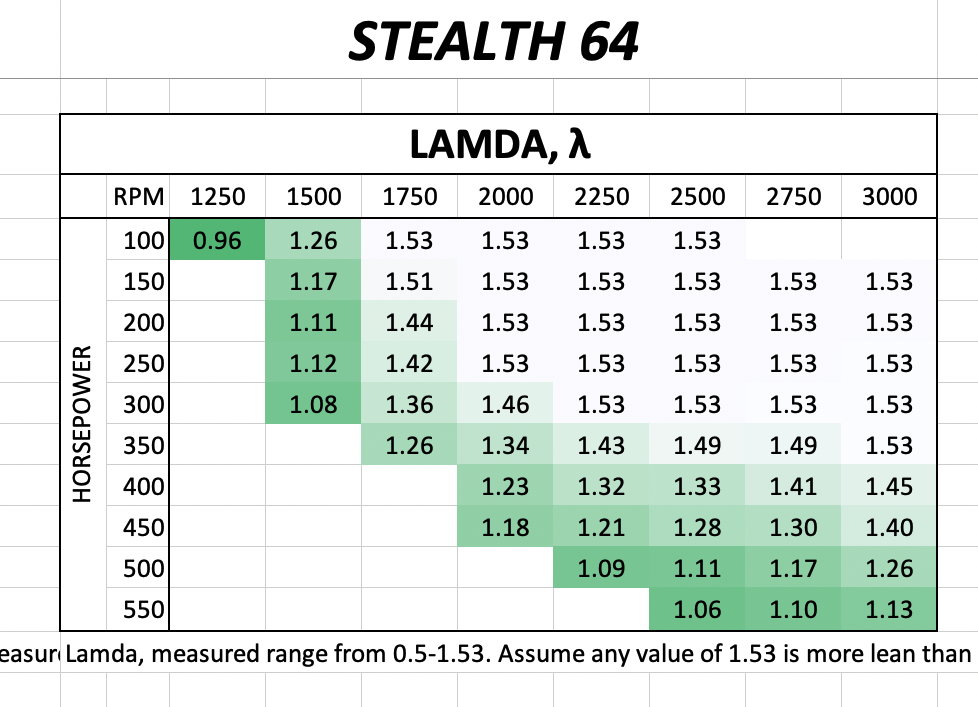
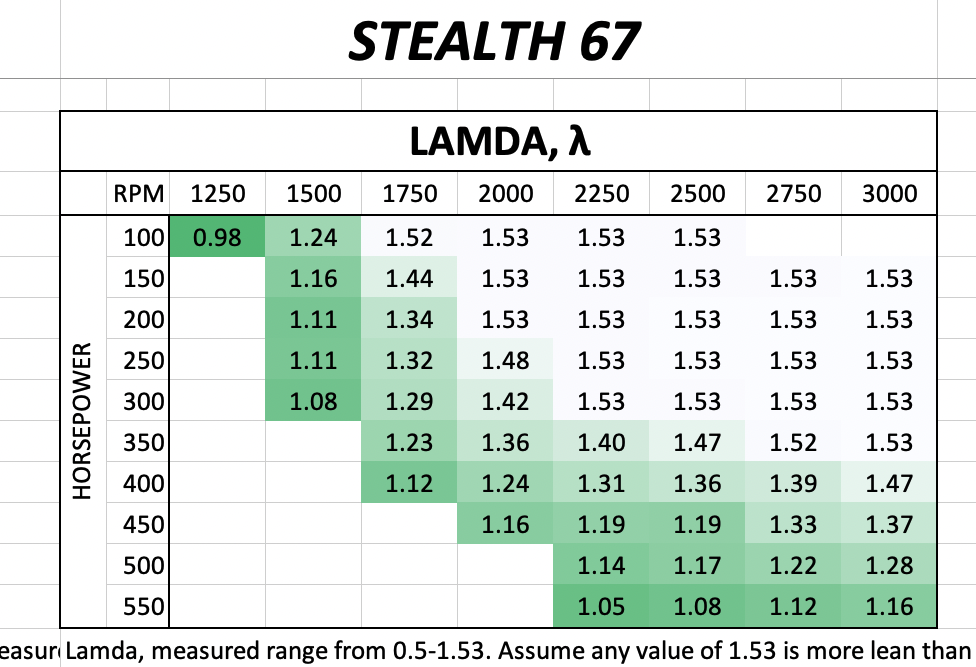
2a. Trends in Lambda:
Analysis of these charts shows 2 trends. The first is that at low RPM (<2000RPM) the larger Stealth 67 had a hard time competing with the smaller units. The flip side to that is as the Stealth 67 revs past 2250 and as it works toward 450HP+ it surpasses the other turbos at supplying clean air. The important thing as a buyer is to look at where you plan on operating the truck most of the time and choose the turbo that best supplies air in that zone. A person who tows regularly of drives a heavy truck on large tires may choose to trade off a little bit of smoke control up-top for excellent airflow supply in the towing range (1500-2000RPM). A stock weight truck on shorter tires (<35inch) that isn't used for towing does not regularly need more than 250HP below 2000RPM. In this case running a Stealth 64/67 requires no compromise and offers significantly more airflow on the big end to keep the truck happy during performance use.
-------------------------------------------------------------------------------------------------------------------------
2b. Intro to EGTs:
In this test we measured temperatures in the exhaust manifold. I would like to caution you right away by stating that this data is yellow. By yellow I mean that the collection of the data was not standardized during testing by constraints like starting temperature or duration of the test. The data in these sets was collected post test and as a result some of the data were collected sequentially, one point directly after another, during the hot tests. Some data was collected at the start of a test cycle, considered a cold sample. With that said, I still include the data because it can be used to show trends. With regard to numbers that concern my during use, typically I start to think twice about my gear and speed while towing if EGTs crest the 1350*F mark in the manifold. This temperature is typically regarded as safe in the long term as long as coolant/oil temps are holding safe. In a performance application its normal to see EGT's move to 1600 and beyond for short intervals. The main turbo concern in these performance applications is melting a turbine or oil seals. This process happens when EGT's exceed 1500* continuously and the oil cooling the turbine shaft is unable to dissipate heat quick enough.
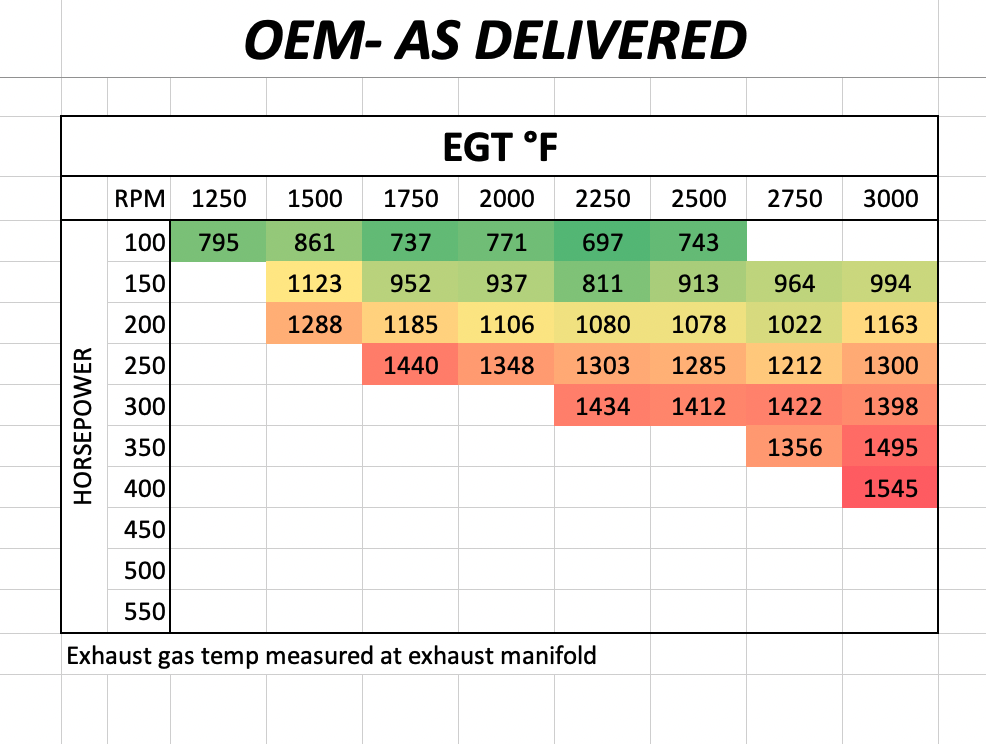
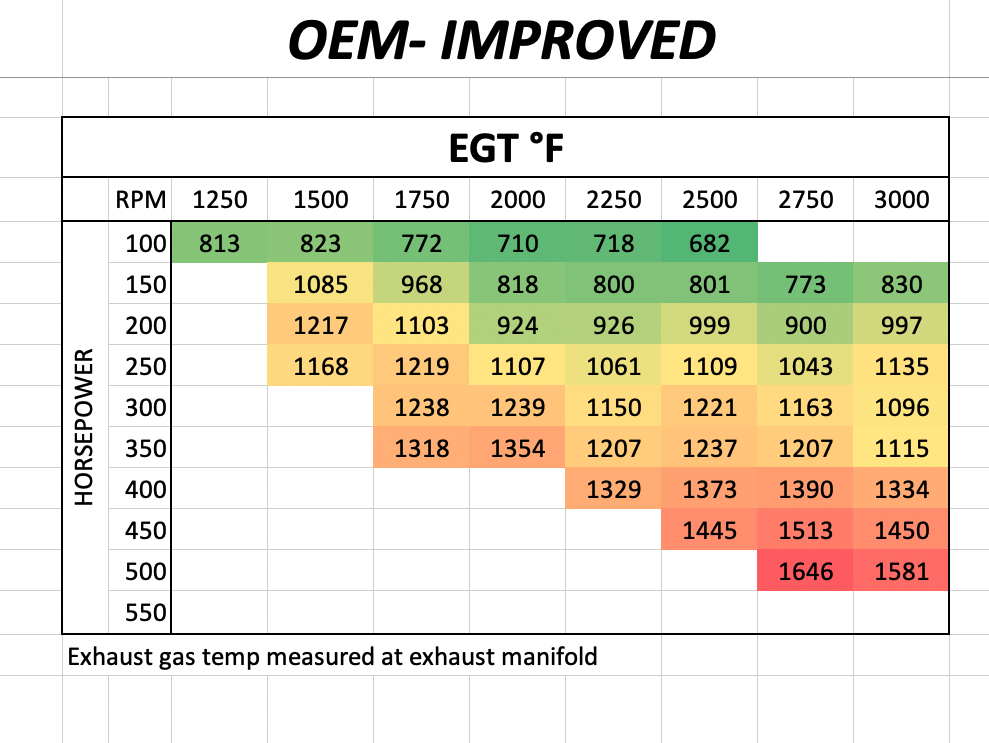
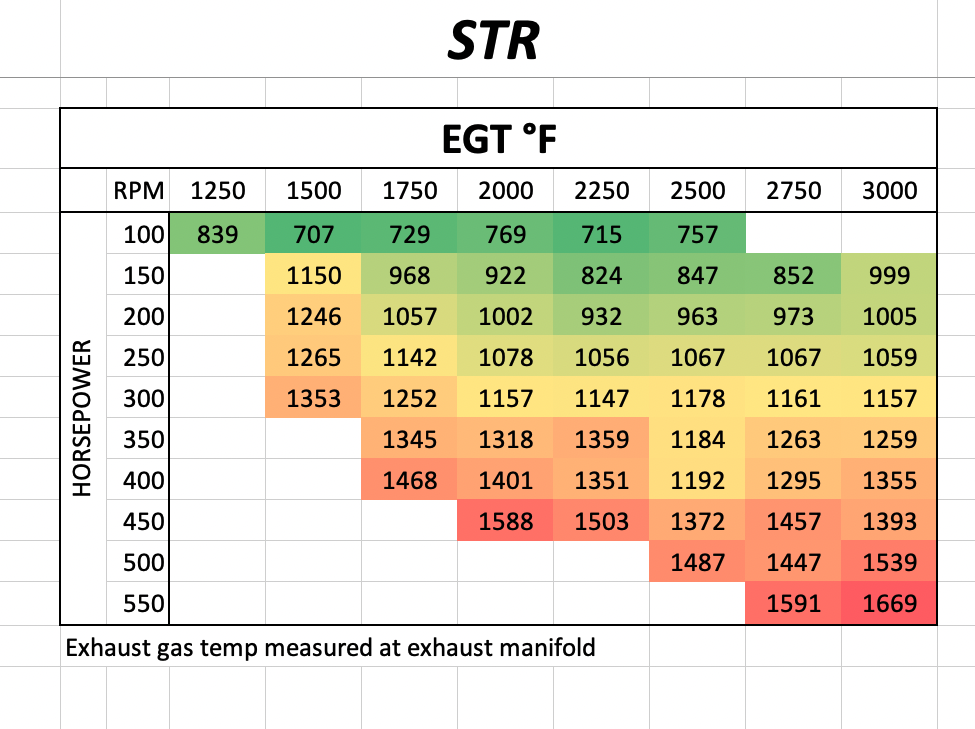
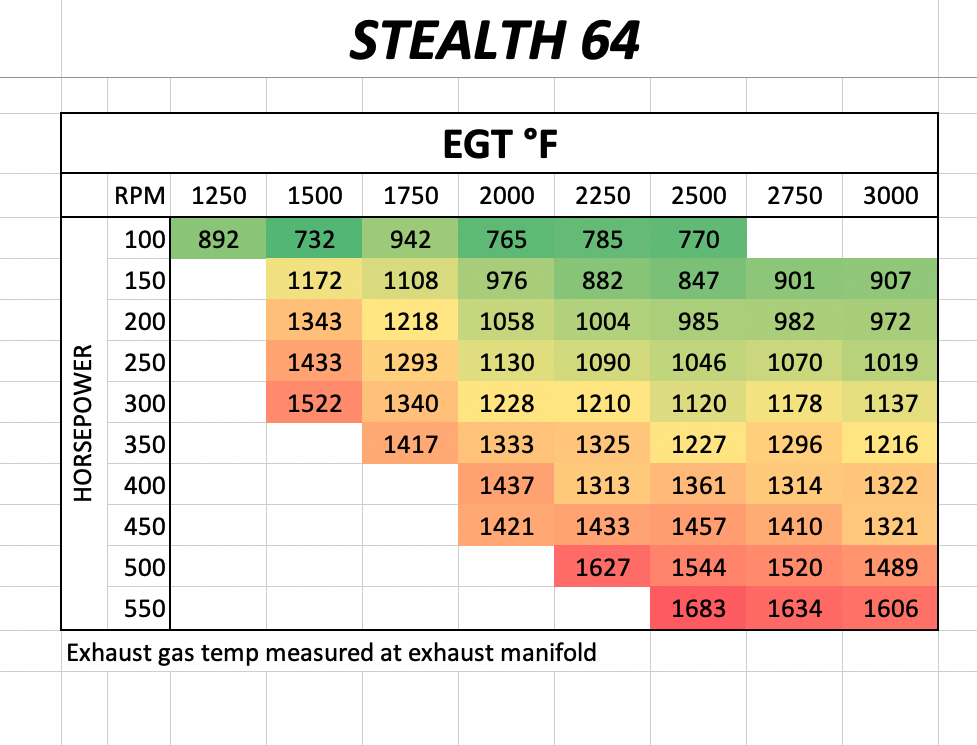
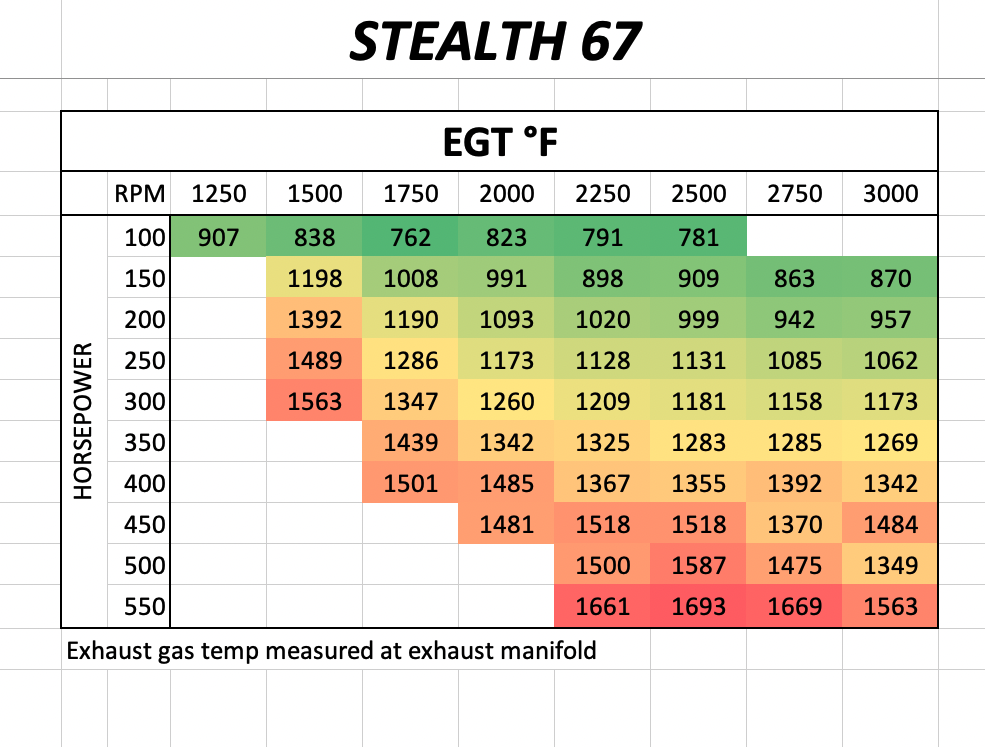
2b. Trends in EGTs:
The OEM as delivered turbo has wastegate settings that quickly put the truck on it's lower lambda limit. Simply put, the truck doesn't make enough boost to allow fueling rates high enough to reach EGT limits. If the fueling rate limits are bypassed in the tune, this turbo will quickly get hot and smoky. As we move to the OEM-Improved, the turbo's ability to make power opens up greatly as its ability to move more fresh air allows higher fueling rates. If you just came from reviewing the lambda charts you'll notice that EGT's are generally safe when lambda values exceed 1.25. Good catch! Fresh air and lower drive pressures go a long way toward managing EGTs. It should also come as no surprise that the larger Stealth 67 has a harder time controlling EGTs while lugging as compared to the STR because it's larger compressor wheel supplies less air at these slower engine speeds. The flipside of course, is that the 64 and 67 cool things off better at higher RPM/Load where their larger wheels come into favor.
--------------------------------------------------------------------------------------------------------------------------------------------------------------------------------------------------
2c. Intro to Turbo Shaft Speed:
Very few OEMs capture turbo speed via sensor data on the truck. Cummins is the only one that comes to mind. With that said, most of the other OEMs model turbo shaft speed in their software. There's a very import reason to track turbo shaft speed though, reliability. The best way to keep a turbo alive is to keep the shaft speed within its design specification. In the aftermarket there is a trend to push and push and push shaft speed limits in a relentless pursuit of the highest power number. While this type of behavior gets customers excited, it also greatly shortens the lifespan of your turbocharger. With that said, one of the constraints of this test was to keep the shaft speed within the same ceiling the factory uses (~135kRPM). Setting these test limits keeps the comparisons apples-to-apples and ensures that we're not inflating our airflow numbers at the cost of reliability. On this type of turbo, shaft speed limits are controlled primarily through the wastegate settings. This can be done via tuning (04.5-07) or via wastegate can/spring modification (03-04).
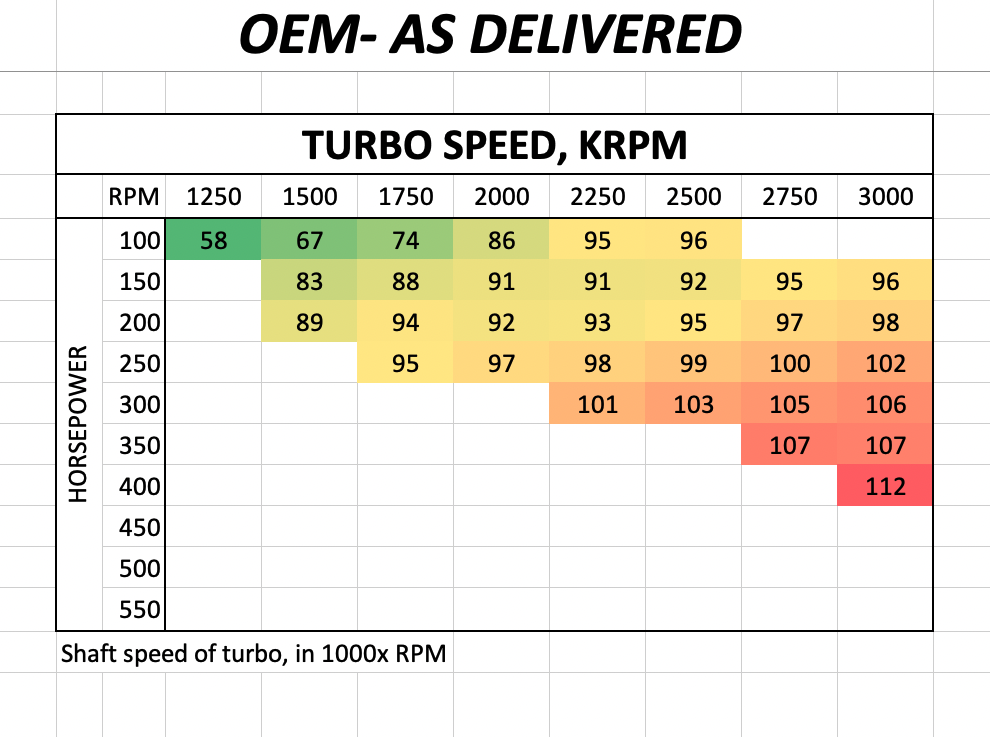
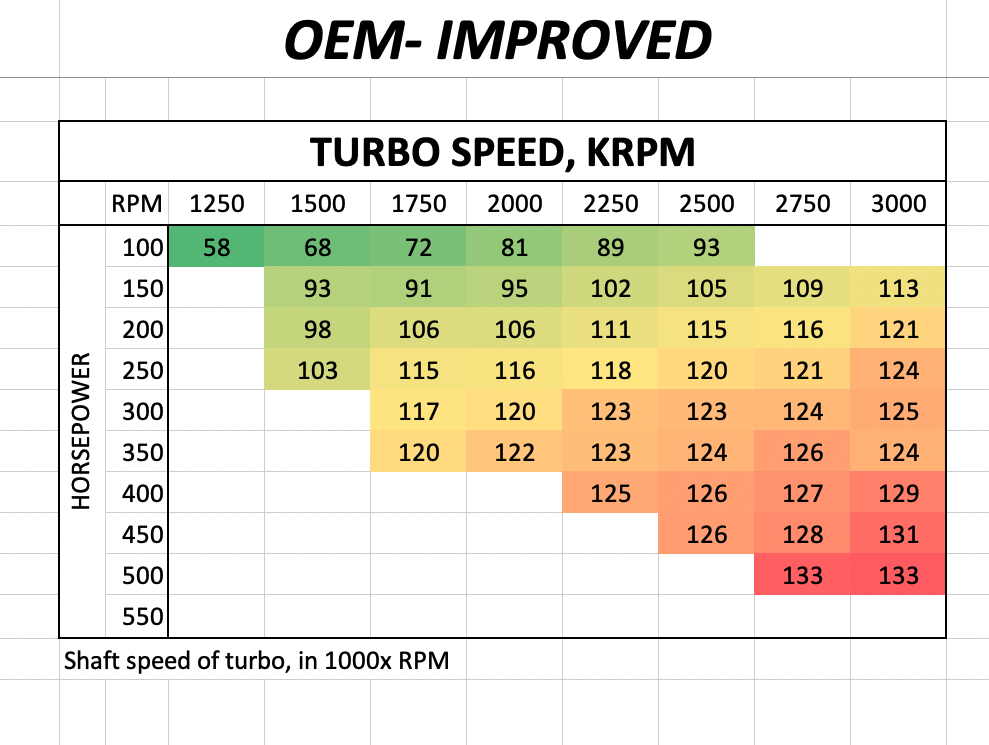
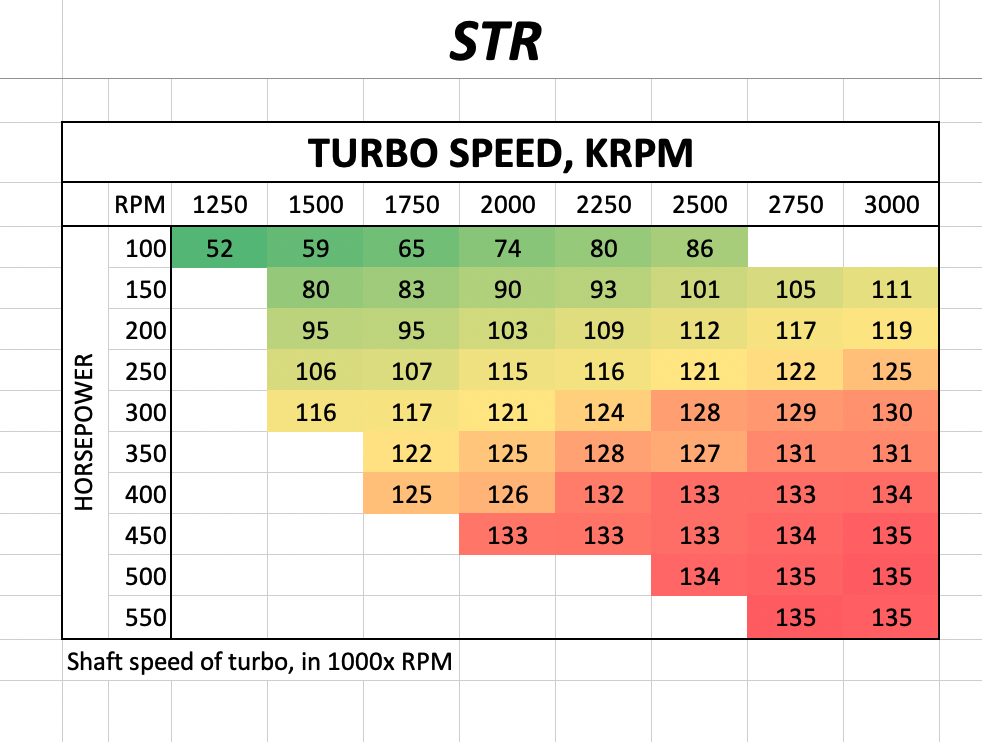
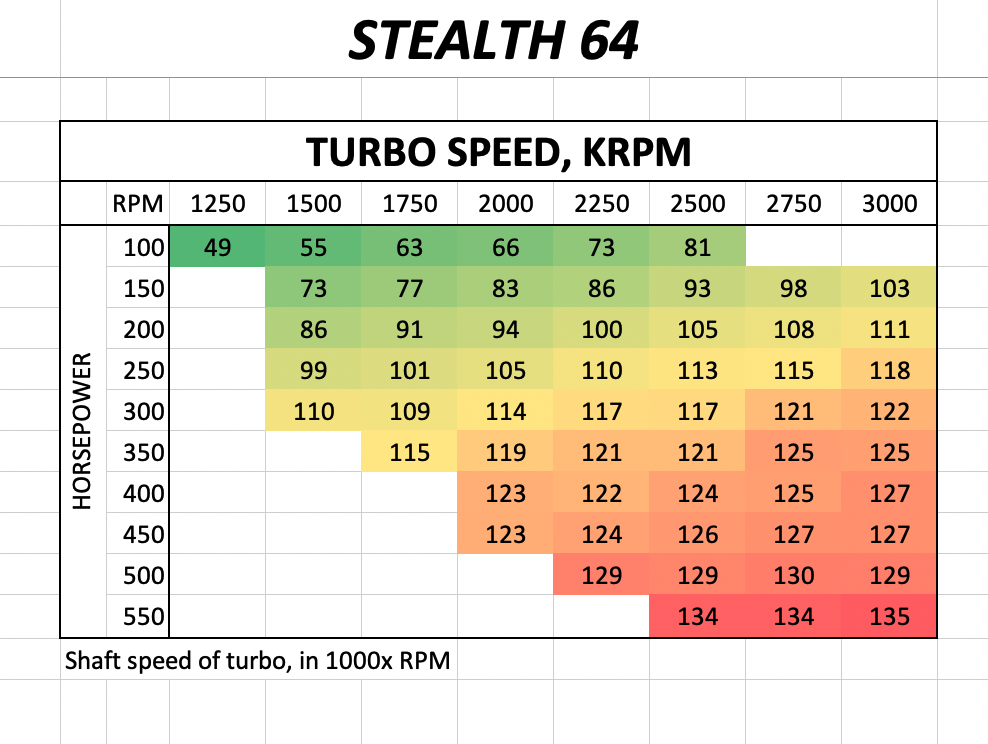
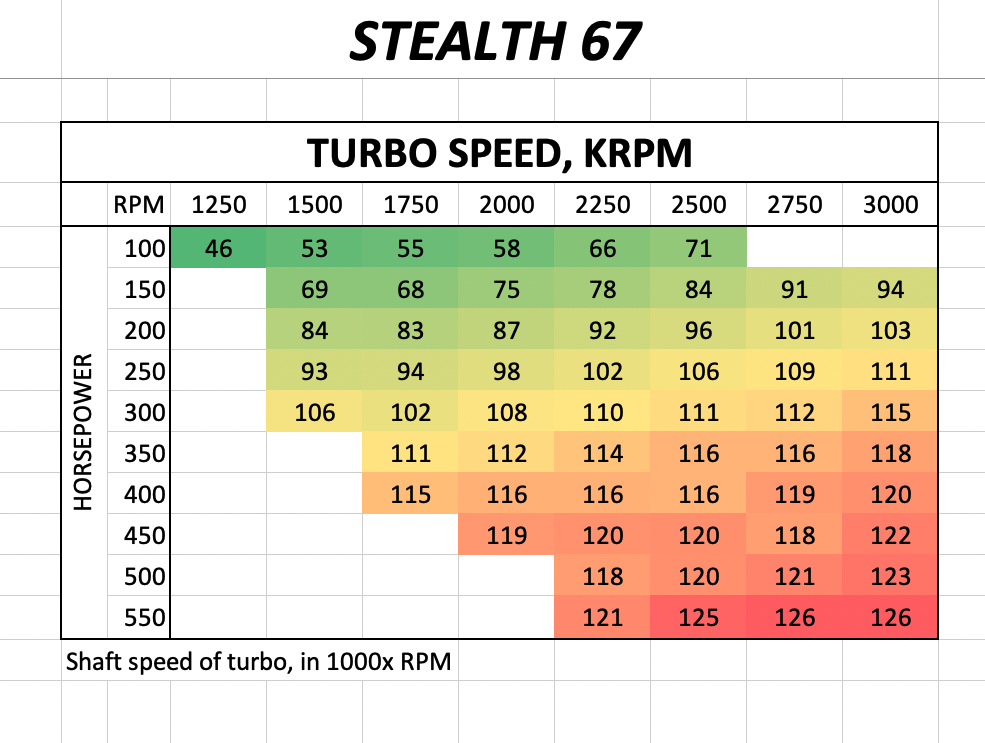
2c. Trends in Turbo Shaft Speed:
The OEM as delivered clearly runs the lowest shaft speeds, hovering around 110kRPM peak. This makes sense because the factory wastegate settings are the most conservative. On the OEM-Improved we snug up the wastegate settings to achieve a 135kRPM limit. This limit is selected as result of data gleamed from the 2013 ISB calibration which has shaft speed safeties built in at this level. In comparing the smaller OEM-improved and STR to the Stealth 64 and 67 it becomes clear that the larger turbos can move more air, and do it using less shaft speed. The take away here is that if you plan to set performance records you'll likely have to compromise on reliability by over-speeding the turbo. This data keeps us honest and gives you piece of mind that reasonable constraints were used.
--------------------------------------------------------------------------------------------------------------------------------------------------------------------------------------------------
2d. Intro to Boost Pressure:
Boost pressure in this test was sampled in the intake manifold after being cooled by the intercooler. Intercooler efficiency in these tests was aided by the use of a 20HP squirrel-cage style blower running against the front of the truck. IAT readings after the intercooler showed pretty conservative ceilings in the ~140*F range. This remained true even when turbo discharge temperatures approached 500*F. The previous sentences are there to qualify the boost reading as being a pretty good relative approximation of airflow rate. Because this platform is not equipped with a MAF sensor, we have to rely on calculated values to hone in on how much much air each turbo is able to move. While the MAF data is impressive to the more technical types, the average owner of one of these trucks is more used to watching a boost gauge.
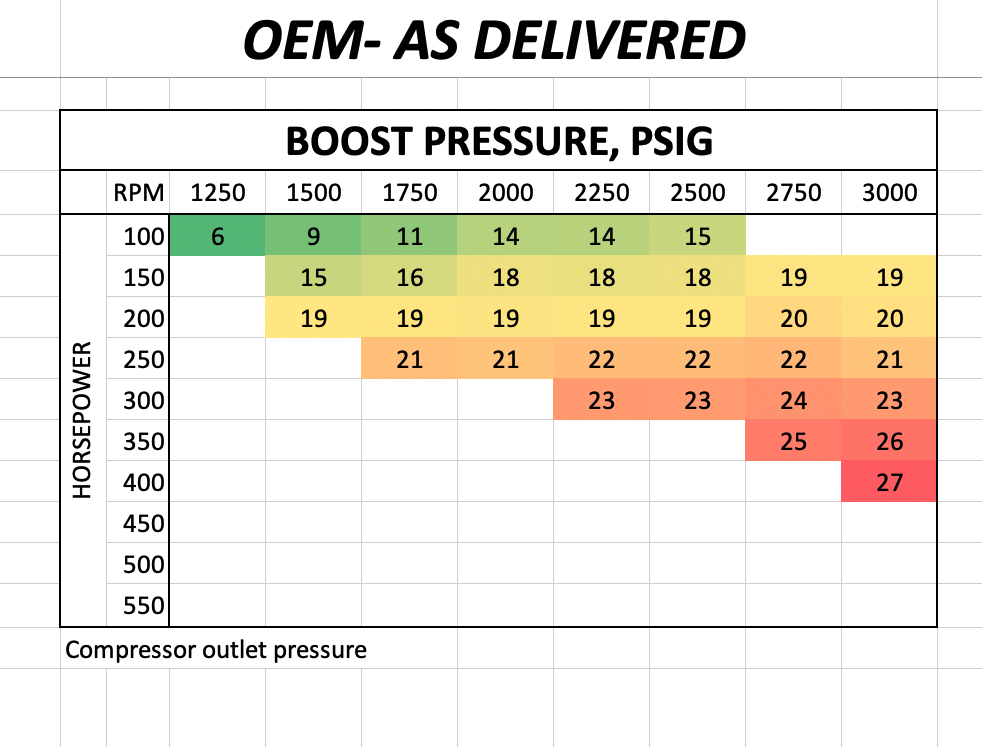
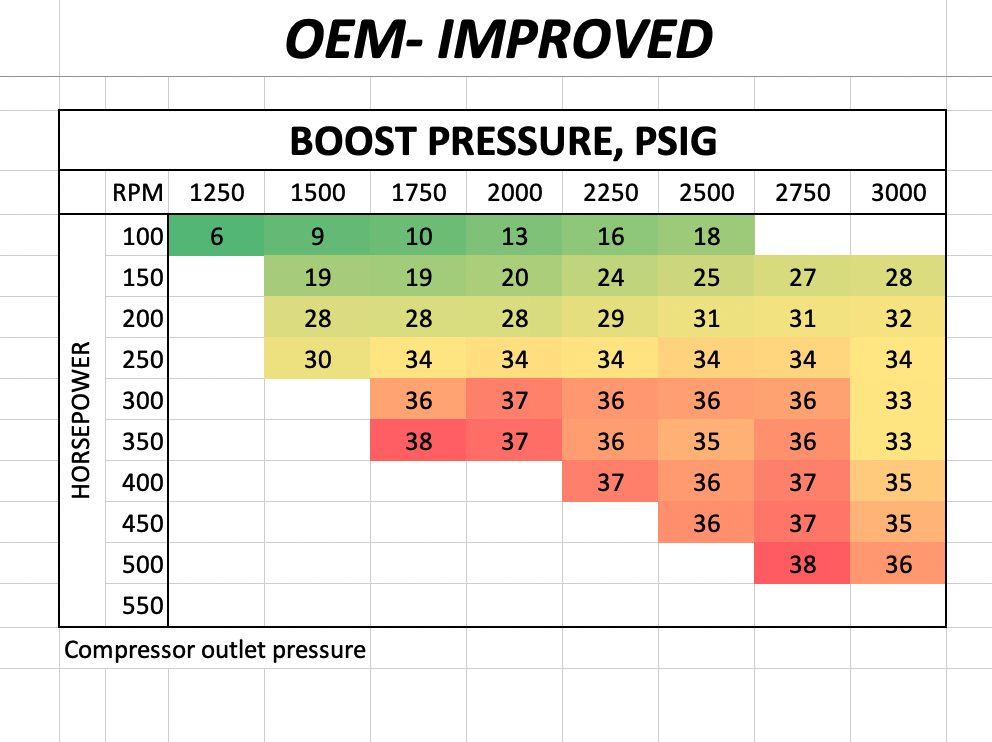
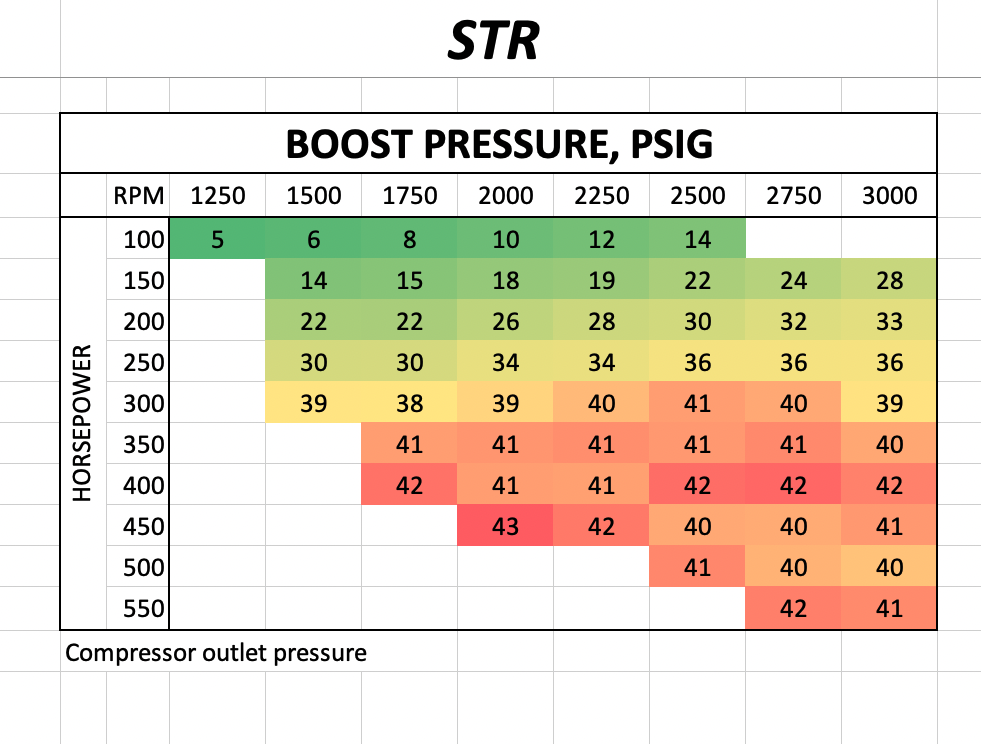
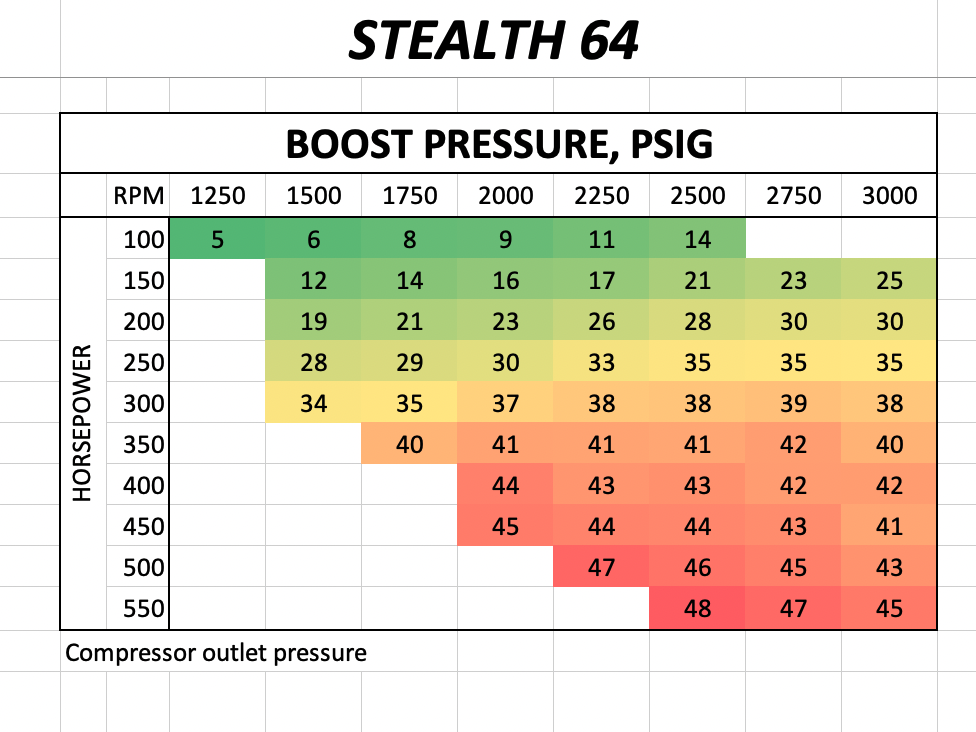
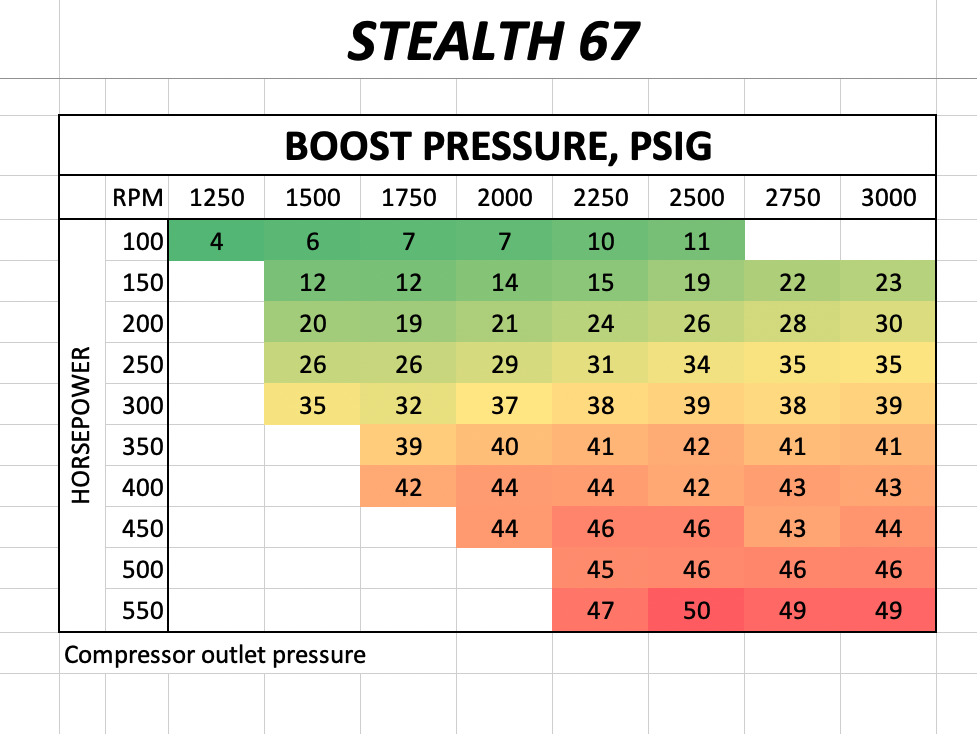
2d. Trends in Boost Pressure:
Now that we've constrained shaft speed via the wastegate settings and constrained our test limits by not testing below ~1.15 Lambda (smoky) we can see that growing from an OEM-Improved turbo up to an STR and beyond immediately results in higher boost numbers. These higher boost numbers support clean operation (higher Lambda) at higher power levels and produce lower EGTs to match. The important thing to remember when looking at these boost numbers is to know that they can only be expected at sea-level and only when operating the truck at matching RPM/Load values.
--------------------------------------------------------------------------------------------------------------------------------------------------------------------------------------------------
2e. Intro to Drive to Boost Pressure Ratios:
Drive pressure or exhaust manifold pressure as it's often referred to was collected using a 12 inch section of copper coil plumbed into the exhaust manifold collector just before the turbo flange. The copper coil allows the exhaust gas to cool and buffers the pulse signal before the pressure transducer. This data is useful because it can be compared to boost pressure to get a sense of the forces at work in the exhaust system. High drive pressure can cause premature exhaust gasket failure or bellows failure (Dmax/Powerstroke). It can also overload the exhaust valve spring and cause sealing/float issue on the exhaust valve. The third reliability issue we see from high drive pressure is unbalanced thrust loading on the turbo and which can result in pre-mature thrust bearing wear and eventually turbo failure. I'll also mention that in our experience designing turbos and monitoring drive pressure we've noticed that when all else is equal the addition of each 1 psi of drive pressure at 3000RPM is worth costs about 1 HP. For example, 20 extra psi of drive pressure will cost roughly 20 HP.

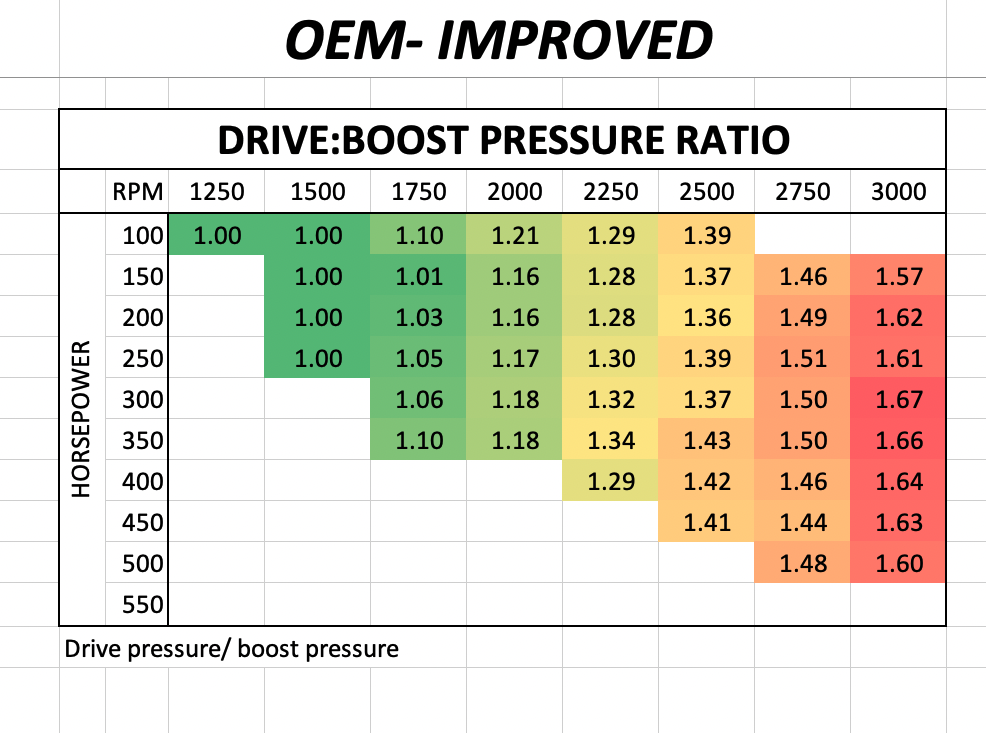
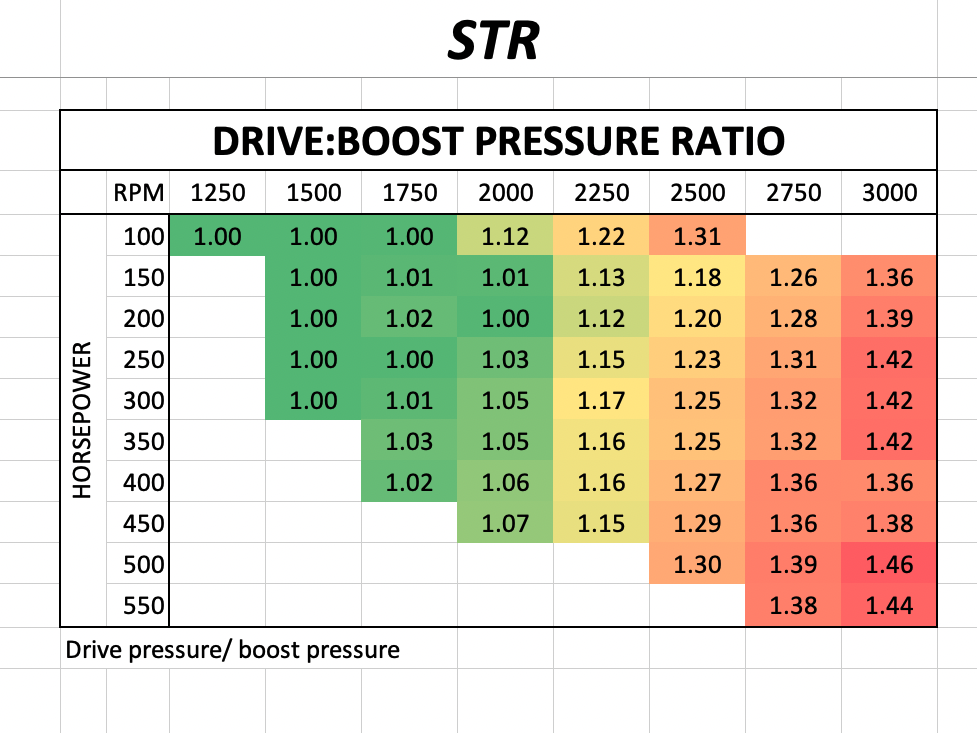
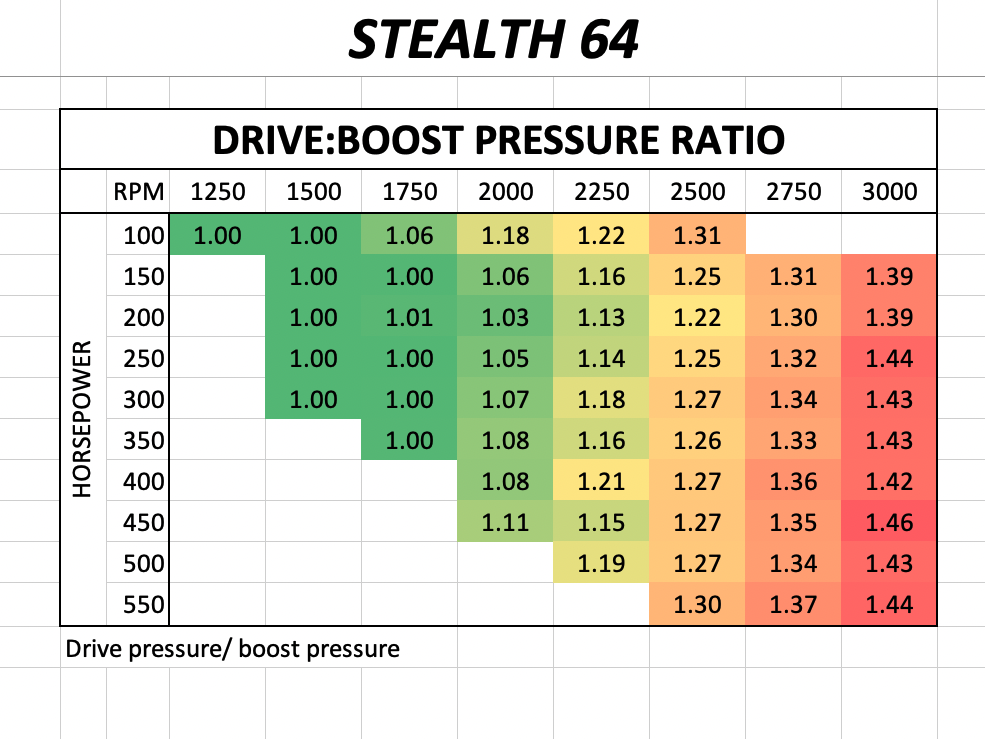
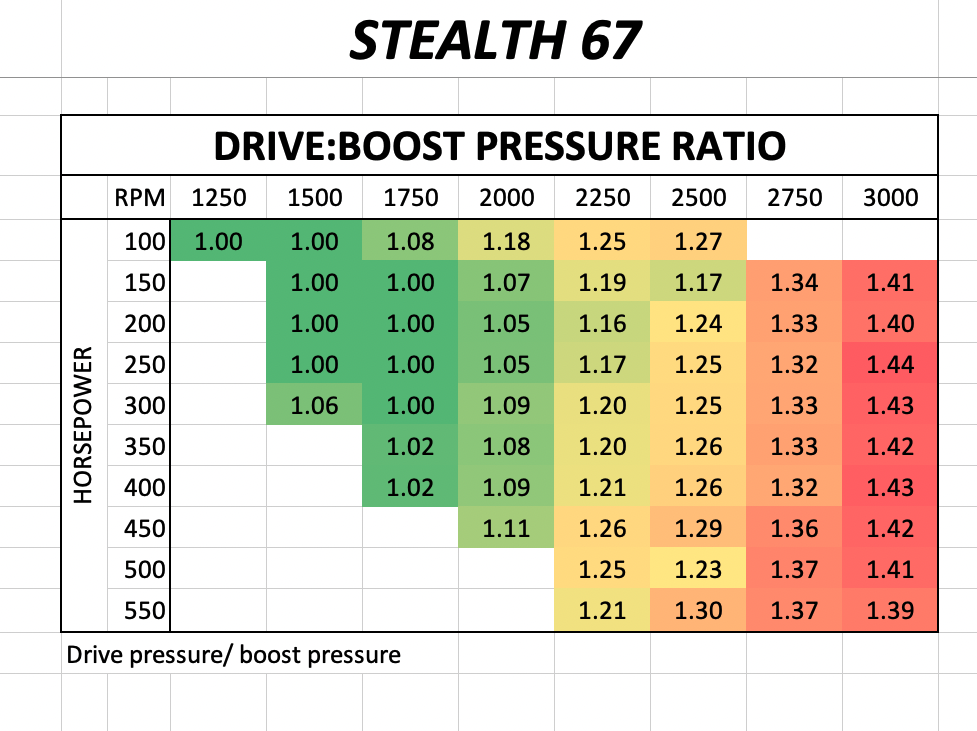
2e. Trends in Drive to Boost Pressure Ratios:
You'll notice in the data that drive pressure trends up with RPM and load. Basically the more boost and (or) the more RPM you run, the more drive pressure is needed. You may scratch you head when you see that peak drive pressure climbs from the OEM-improved to the STR, and Stealth 64/67. It's important to remember the context of boost pressure at each of the load/RPM points. Looking at the drive:boost information is the clearest way I've found to get perspective on the drive pressure data. The ratio data is telling because it shows the STR and Stealth 64/67 turbos ability to maintain balance. The OEM-As delivered unit has low wastegate settings which keep boost, drive, and ratios lower than optimal for performance. The OEM-improved ratios are telling because they are the highest in the test - reaching 1.6x pretty easily while struggling to make 35psi at 3000RPM. Comparing the OEM-improved ratios to the STR and Stealth units offers some clues to the reliability issues often encountered when pushing the OEM-improved turbo to the limit. The thrust bearing group on the OEM improved unit is being forced to deal with 15% more unbalance than the other turbos at the shift point.
--------------------------------------------------------------------------------------------------------------------------------------------------------------------------------------------------
Spool Up Test Data For All 5 Turbos
Spool-Up Test Results (in seconds)
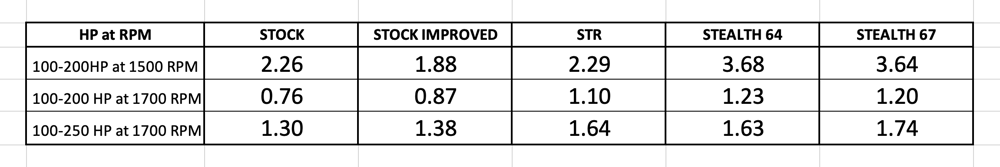
Intro to Spool-up Test:
There's no test standard that we could find to quantitatively describe the phenomena of turbo lag. For that reason we developed the spool-up test. The goal of the test is to compare in relative terms the throttle response a driver might witness while driving each of the turbos. This test was performed by using the dyno to hold the test speed/RPM constant (against the dyno brake) while quickly transitioning the throttle to simulate an immediate need for power. As the truck responds to the throttle by building boost and power we then time how long the truck takes to move through the power window (example 100HP-200HP). The time it takes for the truck to build power to the driver demand deemed it's 'spool-up time'.
Trends in Spool-up Data:
The first anecdotal bit of information I'll add here is that seat of the pants (trained tuning pants, mind you) I cannot tell any difference in response between the stock improved and STR turbos on the street. The 64 and the 67 response time noticeably degrades at 1500 RPM and below comparted to the smaller turbos but if you add a couple hundred extra RPM the difference is almost imperceptible as evidenced by the data at 1700 RPM. Trucks with numerically lower gear ratios, larger tires, and lack of transmission tuning (to raise shift schedule) will suffer the most from the low RPM lag effect. The STR difference of about two tenths of a second is an almost imperceptible small amount of time in the scheme of human activity.
--------------------------------------------------------------------------------------------------------------------------------------------------------------------------------------------------
Max Power Clean (Lambda Limited)
Comments on Max Power (lambda limited) Test:
These data represent the maximum output (Mustang Dyno RWHP) you can expect from each of the turbos in the test along with the PID data collected while reaching said power number. A lambda constraint of 1.10 was chosen because it's where the color out of the pipe turns from clear to a slight haze. Clean power is the most useable and reliable and therefor we encourage sizing the turbo to meet the power goal using the clean limits of the turbo (these and not the ones below). For example, we usually recommend an STR for a truck with a stock fuel system because the limit of the factory CP3 is well matched to the ~550rwhp (620rwhp Dynojet) clean limit of the STR.
Max Power (Competition)

Comments on Max Power (Competition) Test:
Sled pullers and drag racers are often trying to pack the most punch into the least suspicious package and usually do not care about smoke output at these venues. While these turbos were not built with this goal in mind we realize the utility of the data. We retained the maximum shaft speed settings to keep the turbos as reliable as possible in these scenarios but pulled out the smoke limit for this test. Remember the 12.5% difference between Mustang Dyno numbers (reported above) and Dynojet (see below).
The STR is capable of 619*1.125= 696rwhp (dynojet)
The 64mm (Mach 1) is capable of 655*1.125= 737rwhp (dynojet)
The 6&mm (Mach 2) is capable of 730*1.125= 821rwhp (dynojet)
--------------------------------------------------------------------------------------------------------------------------------------------------------------------------------------------------
Conclusion:
This document is a detailed report on the testing of different turbos for the 2003-2007 5.9L Cummins trucks. The study compares various aspects like Lambda (a measure of combustion cleanliness), EGT (Exhaust Gas Temperature), turbo shaft speed, boost pressure, and drive dynamics for different turbos, including the Stealth 67. Key findings highlight that each turbo has its own strengths and trade-offs.
Looking at Lambda, it's clear that the Stealth 67 performs its best at higher RPMs. Further enforcing the importance of matching your turbo to your desired operating range. The EGT data collected showed how well each turbo manages temperatures, especially at different engine speeds. All of the Stealth turbos provided substantially improved EGTs compared to the stock and modified stock turbos. Turbo shaft speeds showcase the reliability of each turbo, and this study also shows that the Stealth line of turbos keeps a balance between power gains and turbo lifespan. Boost pressure indicates how efficiently air moves through the turbos, with larger Stealth variants providing noticeably better performance. Drive dynamics, like drive pressure and drive:boost ratios, reveal insights into exhaust system flow and the reliability benefits of the Stealth series, especially in high-performance situations. This analysis is designed to help users make informed choices based on their driving conditions and performance needs. Its always important to remember that increases in any aspect of performance come with a trade off and you always want to match your turbo to your desired opperating range and driving needs.
If you have any more questions about any of the turbo's used in this study or would like more help deciding what turbo best suits your performance needs. Give us a call at (815)-568-7920 and we would be happy to answer any questions you might have on this topic.
Check out these other 3rd-Gen Cummins related articles:
The First 4 Mods To Do To Your 3rd-Gen 5.9L Cummins
3rd Gen Stealth 67 Turbo for 5.9L Cummins
Calibrated Powers' Switchable Custom Tuning for 03-05 5.9L Cummins
The History of the 5.9L Cummins
